
Technical Visualization Unlocked From Data to Dynamic 3D
Technical Visualization is the craft of turning complex data and abstract processes into clear, intuitive visuals. It’s about taking dense engineering schematics, mounds of scientific data, or invisible operational flows and transforming them into things like dynamic 3D animations and interactive models that anyone can understand in a heartbeat.
What Is Technical Visualization?
Imagine trying to explain the inner workings of a jet engine using only a thick technical manual. Now, picture a dynamic 3D animation that peels back each layer, showing every turbine blade spinning and every system interacting in perfect sync. That’s the real power of technical visualization.
It’s a discipline where engineering precision meets cinematic storytelling. The main goal is to bridge the gap between complex information and human understanding, making the invisible visible and the complicated simple. It’s really about communicating a technical story with clarity and impact.
The Purpose Behind the Picture
Technical visualization isn’t just about making things look good; it’s about hitting specific, practical goals. At its heart, it serves several key functions:
- Simplifying Complexity: It breaks down intricate systems, from molecular interactions to industrial supply chains, into visual stories that are easy to follow.
- Revealing Insights: By visualising data, hidden patterns, inefficiencies, or structural flaws can become immediately obvious. This is invaluable in fields like forensic analysis. For a closer look, you can explore our guide on forensics visualization.
- Enhancing Communication: It creates a common visual language, allowing engineers, marketers, investors, and customers to understand the same concept without any confusion.
- Accelerating Learning: Our brains process visuals much faster than text, making them a powerful tool for training, education, and passing on knowledge.
To get the full picture, it helps to start by understanding visual feedback, a core concept in how we interpret and act on visual information. This discipline ensures that the visuals we create are not just seen but truly understood.
To help break it down, here’s a quick overview of what technical visualization is all about.
Technical Visualization At a Glance
| Aspect | Description |
|---|---|
| Core Goal | To make complex technical information clear, accessible, and understandable through visual media. |
| Key Media | 3D animation, interactive models, motion graphics, photorealistic renderings, data visualisations. |
| Primary Function | Bridges the gap between expert knowledge and audience comprehension, simplifying intricate concepts. |
| Common Use Cases | Product demonstrations, training modules, marketing materials, engineering analysis, legal exhibits. |
| Main Benefit | Enhances communication, accelerates learning, reveals hidden insights, and drives better decision-making. |
This table shows how technical visualization isn’t just one thing but a versatile approach to solving communication challenges across many different fields.
A Growing Need for Clarity
The demand for clear, precise visual communication is on the rise. For example, Poland’s technical testing and analysis sector relies heavily on specialist visualisations for compliance reporting, product documentation, and training.
Industry research estimates this market will grow to approximately €1.9 billion by 2025, with over 6,000 businesses operating in this space. This points to a solid demand for visual assets like animated test procedures and certification videos.
Technical visualization translates the language of machines, data, and processes into the language of human intuition. It’s not just about showing what something is; it’s about explaining how and why it works.
Ultimately, this field gives organisations the power to explain their most important ideas with undeniable clarity, ensuring every stakeholder sees the same picture.
How Technical Visualization Drives Business Value
While the theory is interesting, the real magic happens when technical visualization delivers tangible, measurable results. It stops being a ‘nice-to-have’ and becomes a core business asset that directly impacts your bottom line. It’s the difference between merely describing value and actually demonstrating it.
When complex ideas become crystal clear, decisions get easier, sales cycles shrink, and costly mistakes are sidestepped. From the factory floor to the investor boardroom, visual clarity translates directly into efficiency and growth. This isn’t just about pretty pictures; it’s about strategic communication that delivers a genuine return.
Accelerating Innovation and Product Development
Long before a single piece of metal is cut, technical visualization lets your teams build, test, and perfect products in a virtual space. This digital prototyping process is a game-changer for engineering and R&D, saving an incredible amount of time and money.
Picture an automotive company designing a new electric vehicle. A detailed 3D simulation can test airflow and aerodynamics without ever needing an expensive clay model or a wind tunnel. Engineers can spot design flaws, optimise performance, and iterate on new ideas in a fraction of the time it used to take. This massively reduces the risk of finding a critical problem late in the game—a scenario that would otherwise cause huge delays and budget blowouts.
This thinking extends to entire systems. For manufacturers, a detailed animation of a new assembly line can pinpoint bottlenecks and inefficiencies before the factory is even built. This foresight allows for logistical planning that maximises output from day one.
Revolutionising Training and Knowledge Transfer
How do you effectively train a surgeon on a delicate new medical device? Or teach a field technician to service a complex piece of industrial machinery? Relying on dense manuals is slow, inefficient, and, let’s be honest, often ineffective.
Technical visualization provides a far better way. An interactive 3D animation can guide a user through a procedure step-by-step, letting them see the process from any angle. This kind of immersive learning has been proven to significantly boost knowledge retention.
A well-crafted technical animation doesn’t just show someone what to do; it helps them understand why they are doing it. This deeper comprehension builds competence and confidence far more effectively than static text and diagrams.
This approach delivers clear business benefits:
- Reduced Training Costs: Less time is needed for in-person instruction, and trainers can educate larger groups more effectively.
- Increased Safety: Technicians and operators can practise complex or dangerous procedures in a completely safe virtual environment.
- Improved Consistency: Every team member receives the exact same high-quality instruction, ensuring performance is standardised across the board.
For a medical device company, an animation explaining a new surgical tool can be the key to securing regulatory approval and accelerating its adoption by healthcare professionals.
Empowering Sales and Marketing Efforts
Your sales team can talk all day about your product’s innovative features, but a powerful visual brings those features to life instantly. A high-quality technical visualization makes the abstract concrete, helping potential customers immediately grasp the value and ingenuity of your offer.
Think about a software company selling a complex data analytics platform. A motion graphics video can turn abstract data flows into a clear, compelling story about solving real business problems. Suddenly, it’s far easier for a non-technical stakeholder to understand the product’s benefits.
In the same way, a photorealistic rendering of a proposed architectural project is infinitely more persuasive than a blueprint. It helps clients and investors see the final vision, building excitement and securing buy-in. Visuals cut through the noise, make marketing messages more memorable, and shorten the sales cycle by answering key questions before they’re even asked. By making the complex simple, you empower your audience to make a confident purchasing decision.
The Core Techniques That Bring Data to Life
To really get what technical visualisation is all about, you have to look at the techniques artists and technicians use to turn raw data into a visual story that clicks. These methods are the building blocks of any project. Understanding them helps you explain your vision and pick the right path for what you want to achieve. Each technique has its own job, whether that’s creating a realistic product showcase or making a complex process easy to grasp.
It all starts with a fundamental choice: 2D or 3D? This isn’t just about looks; it’s a strategic decision based on how complex your subject is and the story you need to tell.
Choosing Your Dimension: 2D Versus 3D Animation
2D animation works on a flat plane, a bit like a digital drawing brought to life. It’s perfect for explaining processes, workflows, and abstract ideas in a clear, direct way. Think of it as a smart whiteboard that uses motion to guide the viewer’s eye, making it ideal for explainer videos where clarity is everything.
On the other hand, 3D animation adds depth. It creates a virtual world where objects have volume, texture, and can be seen from any angle. This is essential when you need to show the form and function of a physical object, like a medical device or a piece of industrial machinery. For a closer look at its industrial uses, check out our guide on technical 3D animation for industrial uses.
The Power of Photorealistic Rendering
Once a 3D model is built, the magic of photorealistic rendering begins. This is the process of creating an image from the 3D data that’s almost impossible to tell apart from a real photograph. It involves painstakingly simulating light, shadows, materials, and textures to create a true sense of realism.
For product marketing, this is huge. You can generate perfect images of a product in any setting or colour, long before a physical prototype even exists. This opens the door to stunning marketing campaigns and product catalogues created with total creative freedom and for a fraction of the cost of a traditional photoshoot.
This screenshot from Autodesk’s product visualisation page shows just how digital models are turned into lifelike product images.
The image highlights the incredible level of detail possible, capturing realistic material finishes and lighting that make the digital render feel real enough to touch.
Data-Driven and Interactive Visuals
Technical visualisation can be more than just a static animation; it can be dynamic and interactive. Data-driven visuals are graphics that automatically update based on live data. A factory dashboard showing real-time production numbers is a perfect example, turning streams of data into an intuitive visual summary.
Interactive visuals take things a step further by putting the user in the driver’s seat. Imagine a 3D model of an engine that lets a trainee digitally take it apart and put it back together, exploring each part at their own pace. This hands-on approach makes a massive difference in learning and engagement.
In fact, the adoption of computer vision and technical visualisation in Poland has shot up between 2019 and 2024, pushed by industrial automation. The Polish computer vision market is now a key part of the national AI market, which analysts valued at around $1.0 billion in 2024. This trend has fuelled local demand for high-quality technical animations as clients in manufacturing and medicine ask for more advanced visual work.
Technical visualisation techniques are like a toolkit. The art lies in selecting the right tool—be it the simplicity of 2D or the realism of 3D rendering—to build a bridge of understanding between a complex idea and its audience.
For anyone looking to translate concepts into visuals, it’s interesting to see how modern tools are changing the game. To see how data can be turned into dynamic visual stories, look at how modern AI text-to-video generators are shaking up content creation. These tools offer new ways to quickly prototype visual ideas.
Navigating the Technical Visualization Production Process
Turning a complex idea into a polished technical visualization is a structured, collaborative journey. Think of it less as a mysterious “black box” and more as a clear, well-defined workflow designed to transform your initial concept into a powerful visual asset. The best part? You have key moments for input at every single stage.
Understanding these steps helps demystify how it all comes together and guarantees the final product perfectly aligns with your goals. The journey kicks off with a deep dive into your objectives, moves through creative development and digital construction, and wraps up with the finishing touches that bring the piece to life.
This flowchart gives you a high-level view of the typical flow, from a flat 2D concept to a fully realised 3D render.
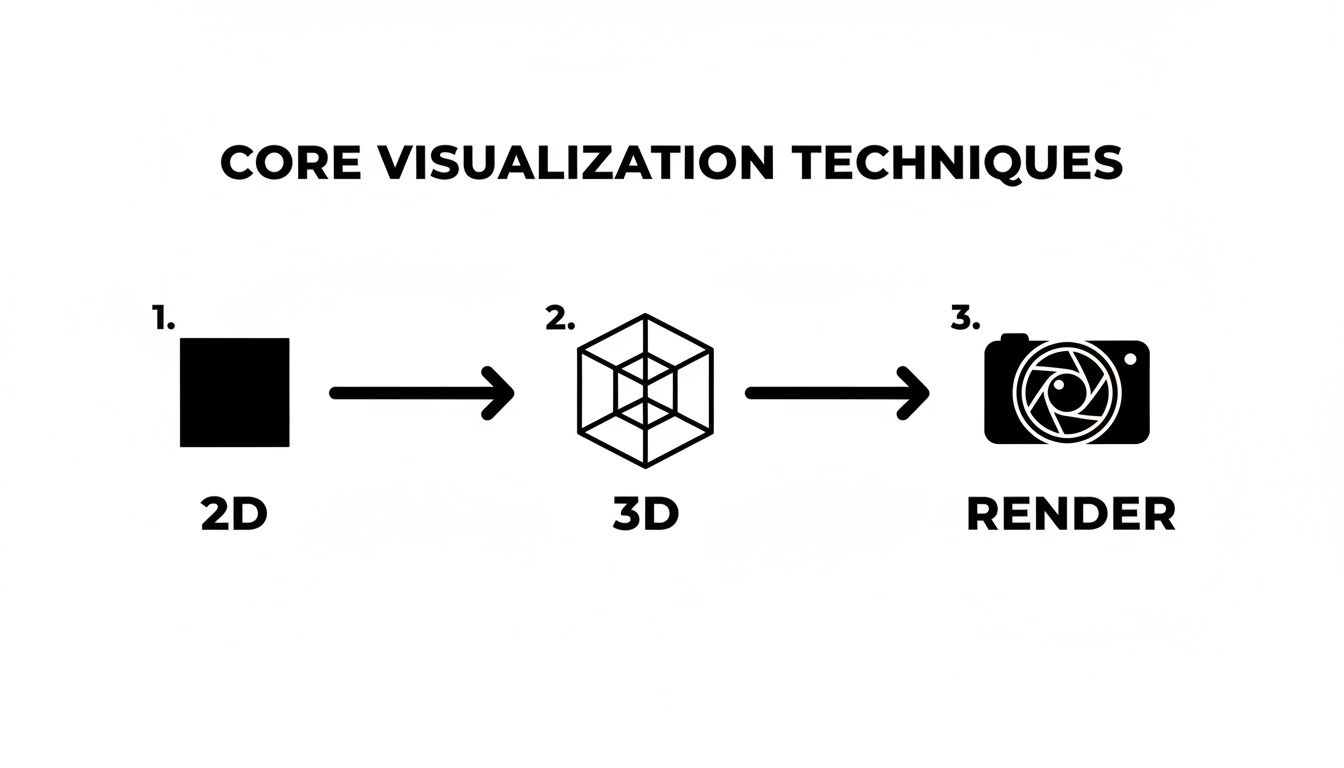
It shows how initial ideas are built into complex digital models before being transformed into polished, photorealistic images that are ready to impress.
Phase 1: Discovery and Strategy
Every project kicks off with discovery. Honestly, this is the most critical phase, as it sets the foundation for everything that follows. We work closely with you to define the core objective. Are we creating an animation to train new staff, secure that next round of investor funding, or launch a new product with a bang?
We also need to pinpoint the target audience. Are we talking to engineers, marketers, or the general public? The answer dictates the tone and level of detail we need to build in. During this stage, we gather all the essentials—CAD files, technical drawings, brand guidelines, and product photos—to ensure total accuracy. The result is a detailed creative brief that becomes our roadmap, locking in the goals and vision before any creative work begins.
Phase 2: Pre-Production and Concept Development
With a clear brief in hand, we jump into pre-production. This is where the visual story really starts taking shape. The first step is usually a storyboard, which is a sequence of sketches that outlines the animation frame by frame, like a comic book version of your video. It’s your first real chance to see the narrative flow and give feedback.
Once the storyboard gets the green light, we often develop an animatic. This is a basic, moving version of the storyboard, timed out with a rough voiceover or music. It gives a much better feel for the video’s pacing and rhythm, allowing for tweaks before we dive into the more intensive 3D work. It’s all about making sure the story is compelling and the message is crystal clear.
Phase 3: Production and Asset Creation
Now for the digital construction. The production phase is where our artists and animators get to work, and it involves a few key steps:
- 3D Modelling: Based on your CAD files or schematics, our artists meticulously build every component of your product or system from scratch in 3D software.
- Texturing and Lighting: We then apply realistic materials, textures, and colours to the 3D models. We also set up virtual lighting to create the right mood and make sure every detail is perfectly illuminated.
- Animation: This is where the magic happens. Following the approved storyboard, our animators bring the models to life, creating fluid, precise motion that clearly explains a process or function.
This is where technical accuracy and artistic skill truly merge. The goal is to build a world that is not only factually correct but also visually engaging, turning dry data into a captivating experience.
Phase 4: Post-Production and Final Delivery
The final leg of the journey is post-production, where we add all the finishing touches. This involves editing the animated sequences together, colour correcting the footage for maximum impact, and integrating any visual effects.
Sound design is also a huge part of this stage. We add a professional voiceover, background music, and sound effects to really enhance the narrative and drive the message home. After a final review and your approval, we render the finished video in all the formats you need—whether it’s for your website, a trade show, or a social media campaign.
To get an even deeper insight into the entire workflow, check out our complete guide to the technical video production process. This structured approach guarantees a high-quality deliverable that nails your business objectives.
How to Successfully Commission Your First Project
Kicking off a technical visualisation project can seem daunting, but a bit of structure makes all the difference. Nailing the commission comes down to clear communication and a realistic grasp of the key factors that influence schedules and budgets.
Getting this right from the very beginning ensures your vision is perfectly understood and the final animation hits all your business goals. It all starts with a solid creative brief.
Crafting an Effective Creative Brief
Think of your creative brief as the architectural plan for your project. A well-thought-out brief is the most critical document you can produce. It cuts out the guesswork, aligns everyone’s expectations, and gives the creative team everything they need to bring your idea to life without a hitch.
Your brief doesn’t have to be a novel, but it does need to be precise. A strong brief answers a few core questions:
- What is the primary objective? Are you chasing investment, training up technicians, or looking to boost sales for a new product? A clear goal is the only way to measure success.
- Who is your target audience? Visuals created for engineers need a completely different level of technical detail compared to a marketing video for the general public.
- What is the single most important message? If your viewer only walks away with one thought, what should it be?
- What assets can you provide? Handing over CAD files, technical drawings, brand guides, and product photos will massively speed up the production process.
By putting in the time to create a thorough brief, you’re paving the way for a smooth and collaborative project. If you’re struggling to frame your message, partnering with an experienced explainer video agency can bring the clarity and storytelling expertise needed to build a brief that truly delivers.
Understanding Timelines and Budgets
Once your brief is locked in, the next step is getting to grips with the practical side of things: budgets and timelines. The cost of any technical visualisation is tied directly to its complexity. Things like the level of 3D detail, the length of the animation, and whether you need photorealistic rendering are the biggest cost drivers.
The Polish market offers a solid frame of reference here. Visual analytics and technical visualisation services represent a growing commercial opportunity within the country’s data-driven economy. Between 2022 and 2024, Polish manufacturing and energy companies significantly increased their spending on projects like predictive-maintenance dashboards and 3D digital twin pilots. Budgets for these initiatives often landed anywhere from tens to hundreds of thousands of euros, showing a strong and consistent demand for skilled studios. You can learn more about the Polish visual analytics market and its growth.
A project’s budget isn’t just a number; it’s a direct reflection of the creative and technical effort involved. Greater complexity requires more specialist time for modelling, animation, and rendering, which naturally impacts the investment.
To give you a clearer picture, let’s break down how different project scopes can translate into different levels of investment and time.
Project Complexity and Budgetary Impact
A good way to set expectations is to compare different types of technical visualisation projects. The scope and complexity have a direct impact on the time and investment needed, as you can see below.
| Project Type | Typical Complexity | Estimated Timeline Range | Relative Budget |
|---|---|---|---|
| Simple Product Spin | A basic 360-degree animated view of a single 3D model with simple lighting. | 1-3 Weeks | € |
| 2D Process Explainer | A short motion graphics video explaining a workflow or software interface. | 3-5 Weeks | €€ |
| 3D Product Animation | A detailed animation showcasing a product’s features and internal workings. | 6-10 Weeks | €€€ |
| Industrial Simulation | A complex, photorealistic animation of an entire system or manufacturing process. | 10-16+ Weeks | €€€€ |
This table is just a general guide to help you get your bearings. The absolute best way to get a precise quote is to walk through your detailed brief with a production studio. With the right information from the start, you can make sure your first project is a success right from that initial conversation.
Common Questions About Technical Visualisation
Thinking about a technical visualisation project often raises a few practical questions about the whole process, the costs involved, and how we’ll work together. Getting these things clear from the start helps everyone get on the same page and makes for a smooth, successful partnership.
This section tackles the most common questions we hear from clients. We want to take the mystery out of commissioning a project so you can feel confident moving forward.
How Much Does a Technical Visualisation Project Cost?
There’s no single price tag, as the cost is tied directly to how complex, long, and detailed the final visual needs to be. The investment can vary quite a bit.
A straightforward 2D animated explainer could start in the low thousands of euros. On the other hand, a highly complex, photorealistic 3D animation for a major product launch or an intricate industrial process can easily run into the tens of thousands. The main factors driving the cost are always the amount of specialist time needed for detailed 3D modelling, the complexity of the animation, and the computer power required for the final rendering. The best first step is always to put together a clear brief so a studio can give you a precise quote for your exact needs.
What Information Do I Need to Provide to Start a Project?
A great project always starts with clear information. A solid creative brief is the key to getting things moving. It doesn’t have to be long, but it does need to be clear.
Here’s what you should include:
- Your Main Goal: What do you need this visual to achieve? Is it for training your team, winning over investors, or marketing a new product to customers?
- Your Target Audience: Who are you speaking to? The technical detail for a group of engineers will be very different from what you’d show to the general public.
- The Core Message: What’s the one single thing you want people to remember after they’ve seen it?
Supplying any existing materials you have is also a massive help. Things like CAD models, technical drawings, brand guidelines, and product photos help us move much faster. The more you can give us upfront, the closer the final result will be to what you have in mind.
How Long Does a Typical Technical Animation Take to Produce?
Just like the cost, the timeline really depends on the project’s complexity. A simple 60-second 2D motion graphics video can often be turned around in about 3-5 weeks.
However, a more detailed 90-second 3D product animation with lots of moving parts will likely take 8-12 weeks, or sometimes longer. This timeframe is carefully mapped out with key moments for your feedback, like reviewing the initial storyboard and the first draft animatic. Clear and timely communication from your side is essential to keeping everything on track. We always provide a full production schedule before any work begins, so you know exactly what to expect.
Protecting client data is not just a policy; it’s a fundamental part of our professional integrity. We build trust by treating your most sensitive innovations with the same care and security as if they were our own.
Can You Work with Our Confidential CAD Data and Prototypes?
Of course. We know we’re often dealing with sensitive, pre-launch information, and protecting your intellectual property is our absolute top priority. Any professional studio will operate under strict Non-Disclosure Agreements (NDAs) to make sure all your confidential data is legally and ethically protected.
We have plenty of experience handling proprietary designs and confidential technical data. Our workflow uses secure file transfer systems and strong internal security measures to keep your assets safe. You can be completely confident that your innovations are in good hands with us.
At Simple Frame, we turn complex technical ideas into clear, engaging visuals that help businesses achieve their goals. If you’re ready to bring your project to life with professional animation, we’re here to help.
Find out how our expertise in technical visualisation can support you by visiting us at https://simpleframe.com.